User Tools
Sidebar
TileCal LED tests
Here is a data library with PMT signals with different attenuators. The dynamic rage is from 1 pC to 2000 pC. The data are collected using R5900 PMT with active dividers and 676 V, and a WLS fibre, Patrick's driver with 4 ns pulse width and David's LED setup.
The talk that describes this study is Studies of PMT block signal shapes using passive and active dividers, Tile upgrade week, Sep 30, 2015
Download the signal files from https://atlaswww.hep.anl.gov/asc/phase2/data/, and then gunzip it. To make a plot for 1 trace, use
wget --no-check-certificate https://atlaswww.hep.anl.gov/asc/phase2/data/pmt_signals_phase2.tgz -O - | tar -xz;
cd pmt_signals_phase2/
python show_trace.py data/D1_traces_full.txt.gz 1 # show 1st trace out of 1000
We used several 50% (0.3) neutral density filters (NDF50), and 1 neutral density filter x16 (NDF16). Data files with traces are in “data/*”. There are 1000 traces in each file. The file names has a letter “D” that indicates attenuation strength for the light.
- D1 NDF16 + 6xNDF50. Reduction of light by 6*2*16. About 0.3 pc → x1024
- D2 NDF16 + 5xNDF50 → x512
- D3 NDF16 + 4xNDF50 → x256
- D4 NDF16 + 3xNDF50 → x128
- D5 NDF16 + 2xNDF50 → x64
- D6 NDF16 + 1xNDF50 → x32
- D7 NDF16 (light reduction by a factor 16) → x16
- D8 3xNDF50 → x8
- D9 2xNDF50 → x4
- D10 1xNDF50 (light reduction by a factor 2) → x2
- D11 - no NDF. About 2000 pC →0
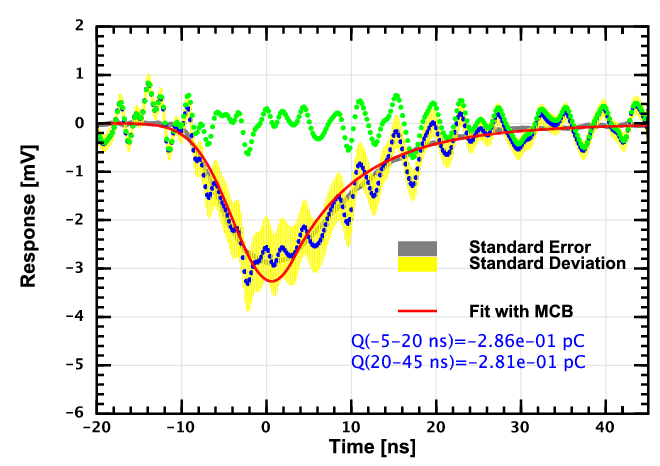
Figures for 1000 traces are in “figures”. Each trace was centralized at time=0. We use a numeric noise suppression for all traces as shown in this image.
Blue lines show traces before the noise removal, and small grey dots after the noise suppression. The green dots show the noise in the LED driver.
— Sergei Chekanov 2015/07/17 14:00


